# Preface {.unnumbered}
> *"The introduction of optical fiber systems will revolutionize the communications network.
> The low-transmission loss and the large bandwidth capability of the fiber systems allow
> signals to be transmitted for establishing communications contacts over large distances
> with few or no provisions of intermediate amplification."*
> — Charles K. Kao, 1982 (Nobel Prize in Physics, 2009)
This companion follows the slides of **Chapter 2 — Dielectric Waveguides and Optical Fibers**
section by section. The slides tell the story; this book lets you **compute it**. Every
figure is produced by a few lines of Python that you can unfold ("Show the Python"),
copy, and modify. Most chapters also have **live panels** (sliders, marked with a blue bar on the left)
that recompute directly in your browser. They need no Python installation.
## How the book is organised
| Chapter | Slides | What you can play with |
|---|---|---|
| [Planar waveguides](planar.qmd) | 7–39 | graphical mode solver, TIR phase, mode fields, dispersion diagram, $v_g(\omega)$ |
| [Step-index fibers](fibers.qmd) | 40–64 | exact LP-mode solver, $b$–$V$ chart, 2-D mode patterns, MFD, fiber designer |
| [Dispersion](dispersion.qmd) | 65–95 | Sellmeier glasses, $D_m$, $D_w$, zero-dispersion engineering, PMD random walk, compensation |
| [Graded-index fibers](grin.qmd) | 122–134 | ray tracing in a GRIN core, optimum profile $\gamma$, GRIN rod lens |
| [Attenuation & bending](attenuation.qmd) | 135–162 | loss spectrum builder, Rayleigh limit, bend-loss fitting |
| [Bit rate & capacity](bitrate.qmd) | 96–121 | Nyquist/Shannon, Gaussian pulse broadening, a full IM/DD link simulator with eye diagrams |
| [WDM, couplers & nonlinearity](wdm.qmd) | 174–194 | ITU grid, couplers, star couplers, four-wave-mixing product map, SPM chirp, SBS |
| [Special fibers & FBGs](special-fbg.qmd) | 195–230 | Bragg fibers, coupled-mode FBG spectra, strain/temperature sensing |
| [Fiber sensors](sensors.qmd) | 231–311 | OTDR trace simulator, Raman DTS, Brillouin, Fabry–Perot, Sagnac gyroscope |
| [Projects & new ideas](ideas.qmd) | — | suggestions to extend the course |
Each chapter ends with **"Try it yourself"** exercises. Where a slide contains a worked example,
the companion **recomputes it** and gives the number, so you can check your hand calculation.
::: {.callout-note}
## Notation used throughout
$n_1$ core index, $n_2$ cladding index, $a$ core radius (fiber) or half-thickness (slab),
$\Delta=(n_1^2-n_2^2)/2n_1^2\approx (n_1-n_2)/n_1$, $\mathrm{NA}=\sqrt{n_1^2-n_2^2}$,
$V=\frac{2\pi a}{\lambda}\mathrm{NA}$, $b=(n_\text{eff}^2-n_2^2)/(n_1^2-n_2^2)$.
Python uses SI units. Dispersion is quoted in ps nm$^{-1}$ km$^{-1}$.
:::
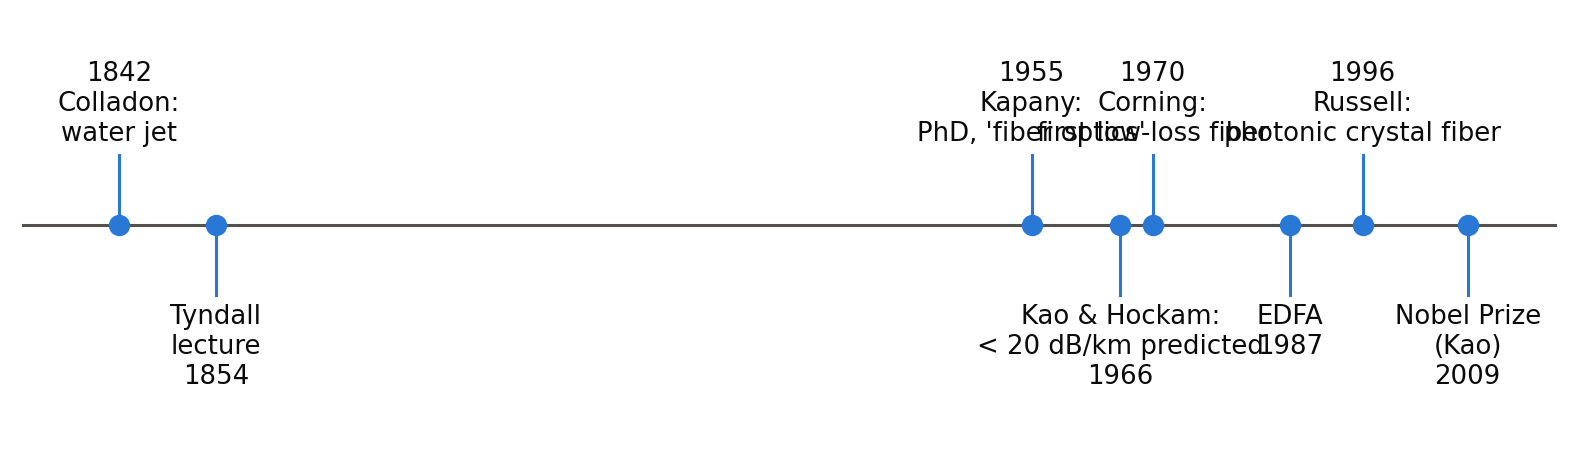
## A bit of history (slides 1–5)
```{python}
#| label: fig-timeline
#| fig-cap: "Some milestones of light guiding mentioned in the slides."
#| fig-height: 2.4
import matplotlib.pyplot as plt
import fiberlib as fl
fl.use_style()

events = [(1842, "Colladon:\nwater jet"), (1854, "Tyndall\nlecture"),
          (1955, "Kapany:\nPhD, 'fiber optics'"), (1966, "Kao & Hockam:\n< 20 dB/km predicted"),
          (1970, "Corning:\nfirst low-loss fiber"), (1987, "EDFA"),
          (1996, "Russell:\nphotonic crystal fiber"), (2009, "Nobel Prize\n(Kao)")]
fig, ax = plt.subplots(figsize=(9, 2.4))
ax.axhline(0, color=fl.INK2, lw=1)
for i, (y, txt) in enumerate(events):
    up = 1 if i % 2 == 0 else -1
    ax.plot([y, y], [0, 0.55 * up], color=fl.PALETTE[0], lw=1)
    ax.plot(y, 0, "o", ms=6, color=fl.PALETTE[0])
    ax.text(y, 0.62 * up, f"{y}\n{txt}" if up > 0 else f"{txt}\n{y}",
            ha="center", va="bottom" if up > 0 else "top", fontsize=8.5, color=fl.INK)
ax.set_ylim(-1.6, 1.6); ax.set_xlim(1830, 2020)
ax.axis("off")
plt.show()
```
The time axis is not linear in "interest": it took more than a century to go from Colladon's
water jet to a usable glass fiber. The breakthrough was **materials purity** (Kao's
prediction that intrinsic glass losses could fall below 20 dB/km), not a new idea about guiding.
The chapter [Attenuation & bending](attenuation.qmd) shows why: today's 0.15–0.2 dB/km
sit close to the *Rayleigh limit* of silica.
## Running the code without installing anything
Every chapter starts with an **Open in Colab** button that opens its code as a notebook in Google Colab.
Colab is free and runs in the browser; you only need a Google account. The interactive ipywidgets explorers are here:
[](https://colab.research.google.com/github/{{< var github_user >}}/{{< var repo >}}/blob/main/{{< var subdir >}}/notebooks/interactive_explorers.ipynb)
To keep your changes, use *File → Save a copy in Drive* in Colab.
## Using the code
All functions live in a small, readable module, [`fiberlib.py`](fiberlib.py) (~400 lines),
which you can import from your own notebooks:
```python
import fiberlib as fl
fl.LP_all(V=5)                 # list of guided LP modes (l, m, b)
fl.D_material(1.55e-6)         # material dispersion of silica [s/m^2]
```
See the appendix [Running the notebooks](running.qmd) for installation, and for how to turn
every chapter into a Jupyter notebook.